
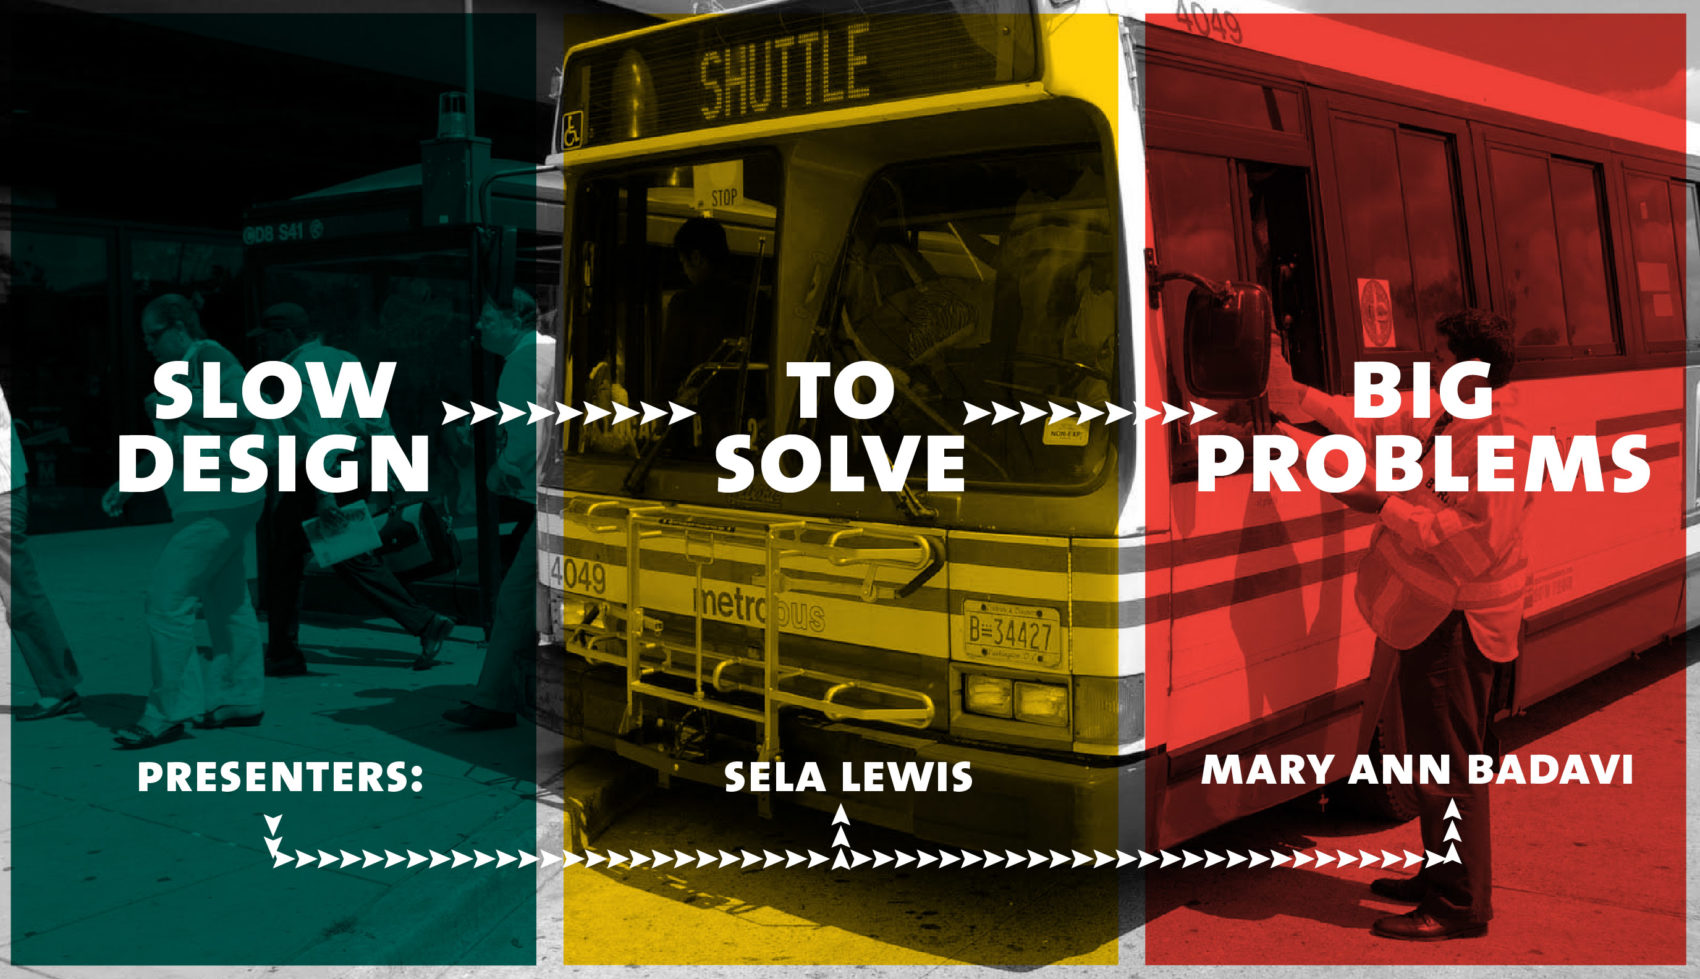
Presentation | Slow Design to Solve Big Problems
Presentation | Slow Design to Solve Big Problems
Description
[responsivevoice_button voice=”UK English Female” buttontext=”Listen to This”]
“Slow Design to Solve Big Problems” a service design workshop presented by Mary Ann Badavi and me at this year’s UX Week, Pt. 1 and Pt. 2.
BACKGROUND AND RESEARCH
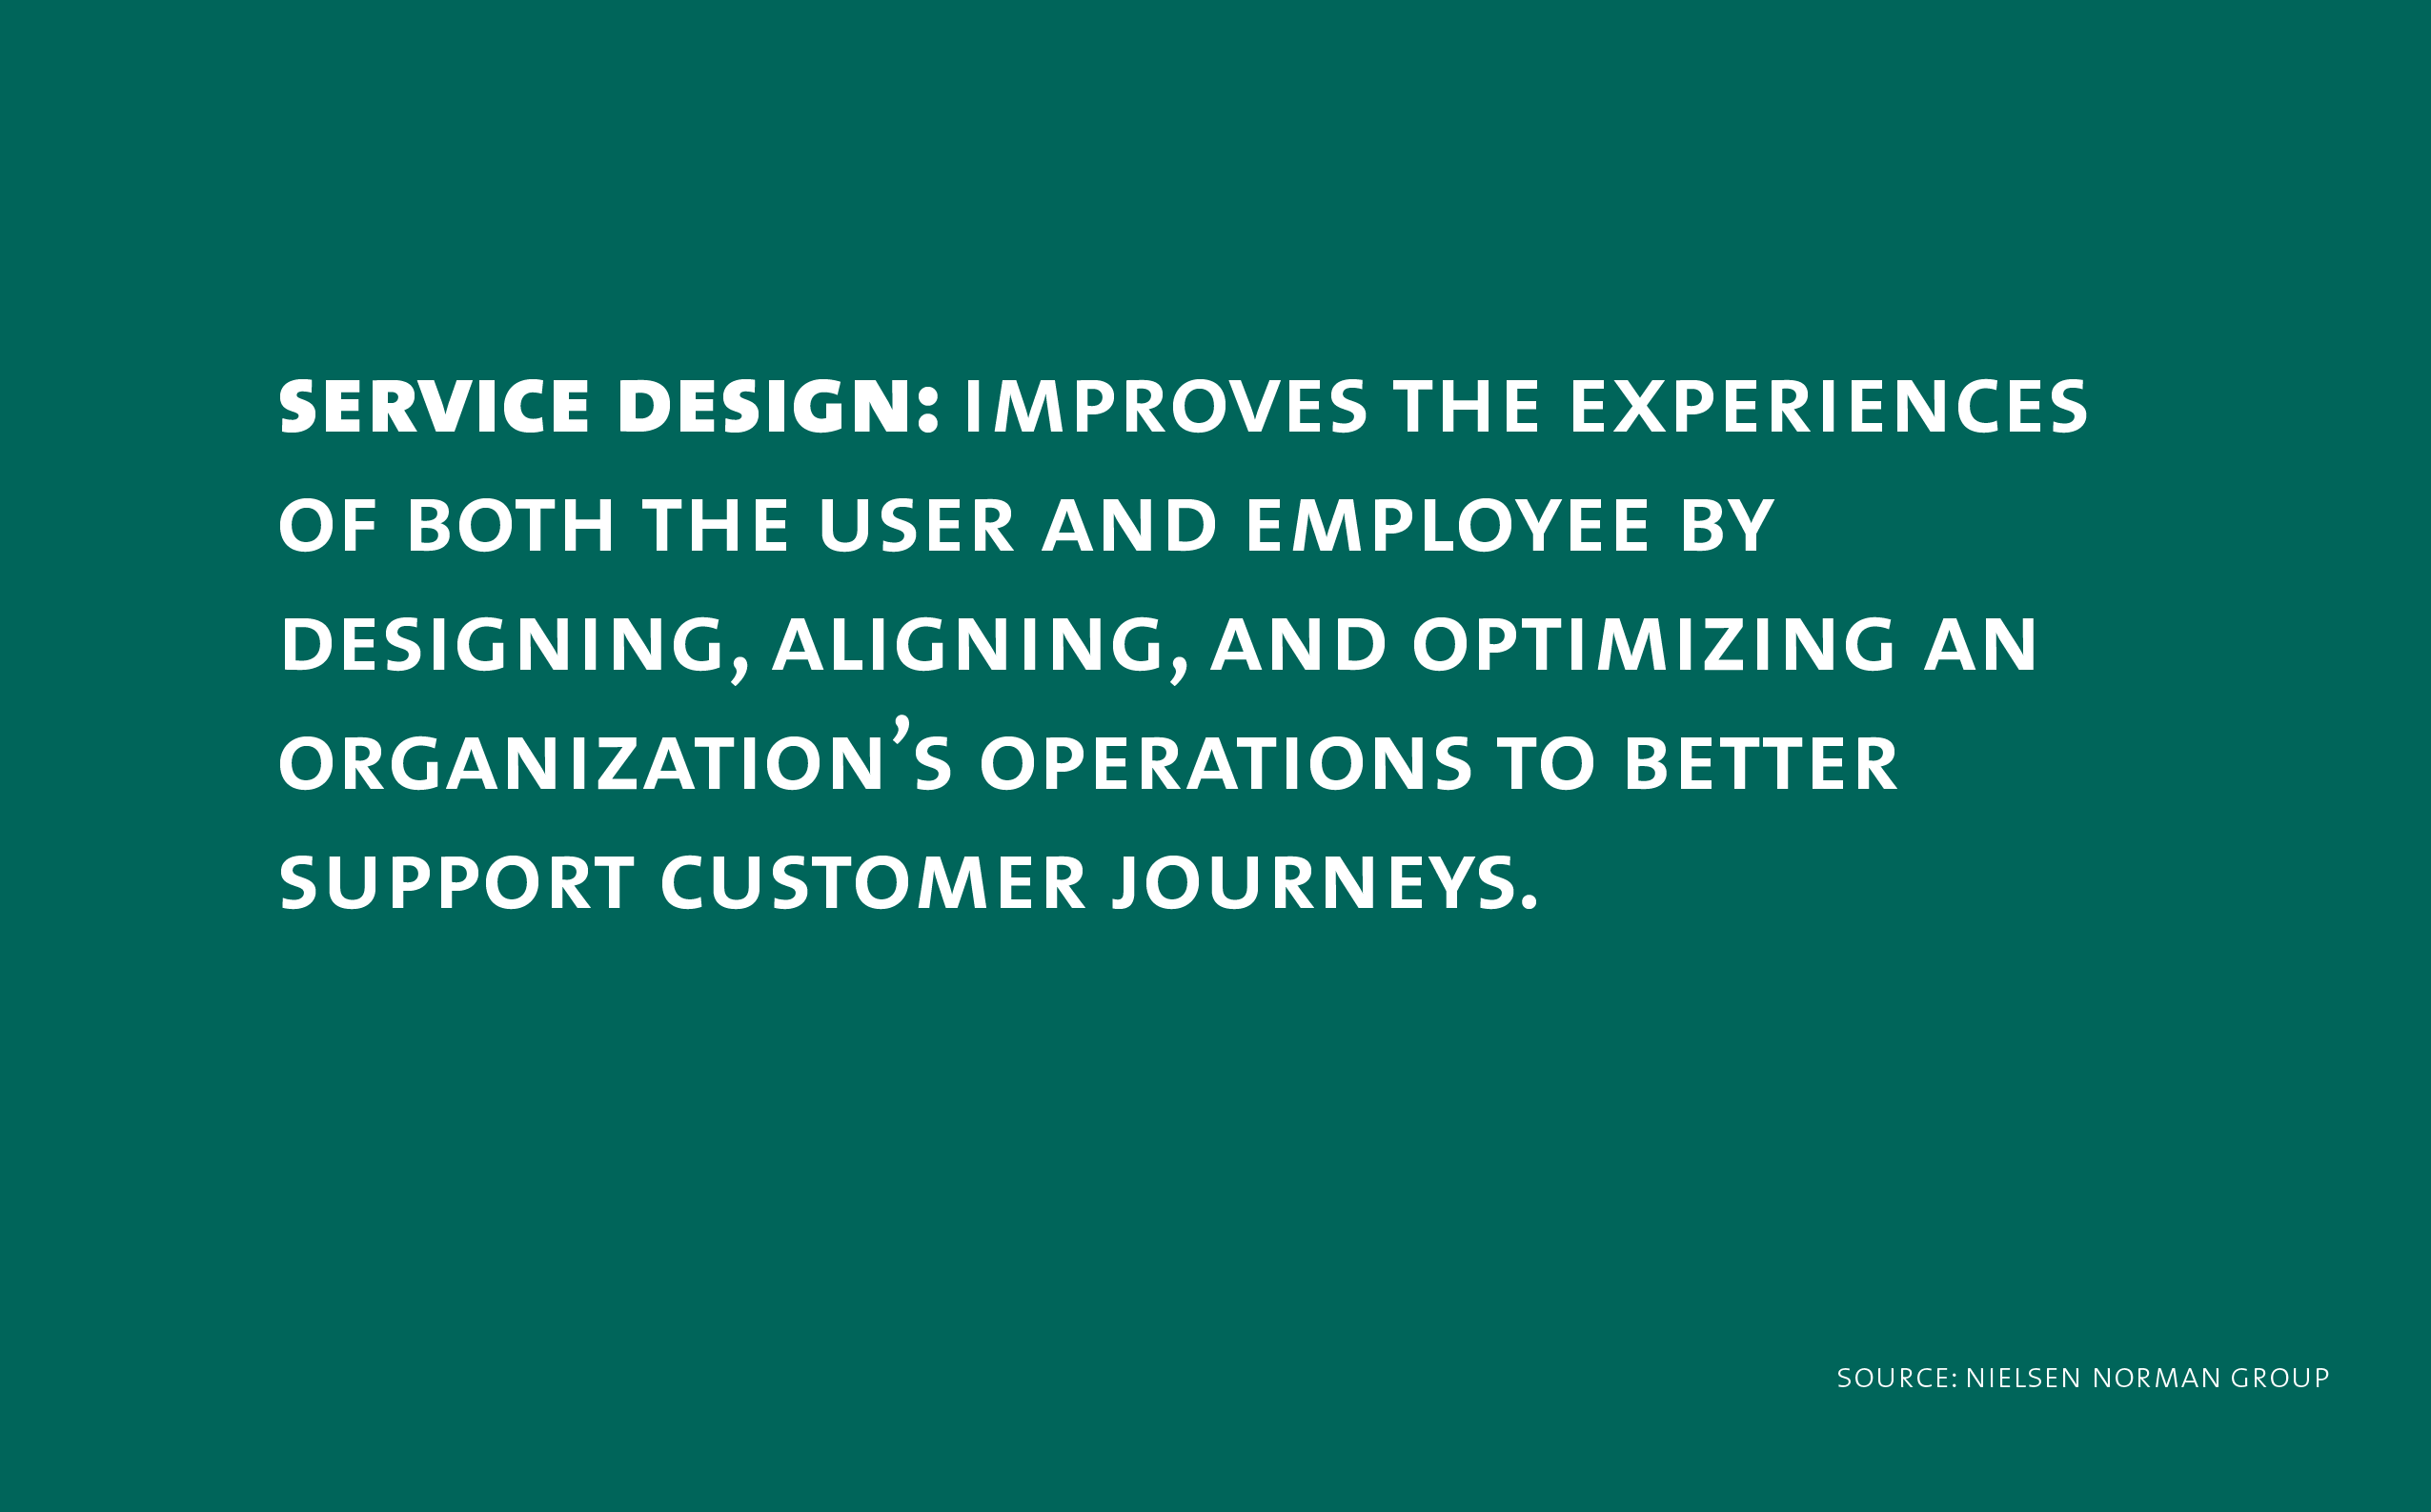
We admittedly did not have a lot of experience in service design. But with a combined 20 years of design experience, do know that a lot of designers are making too many apps, and not enough are engaging in the physical world to solve problems. So we started with the basics, and looked to credible sources on service design to learn more about the field.
OBSERVATIONS AND FIELD STUDY
We spent an afternoon briefly observing a bus line in D.C. We looked at everything: The bus signage, the shelters, the digital screens, the advertising wraparounds, the apps.
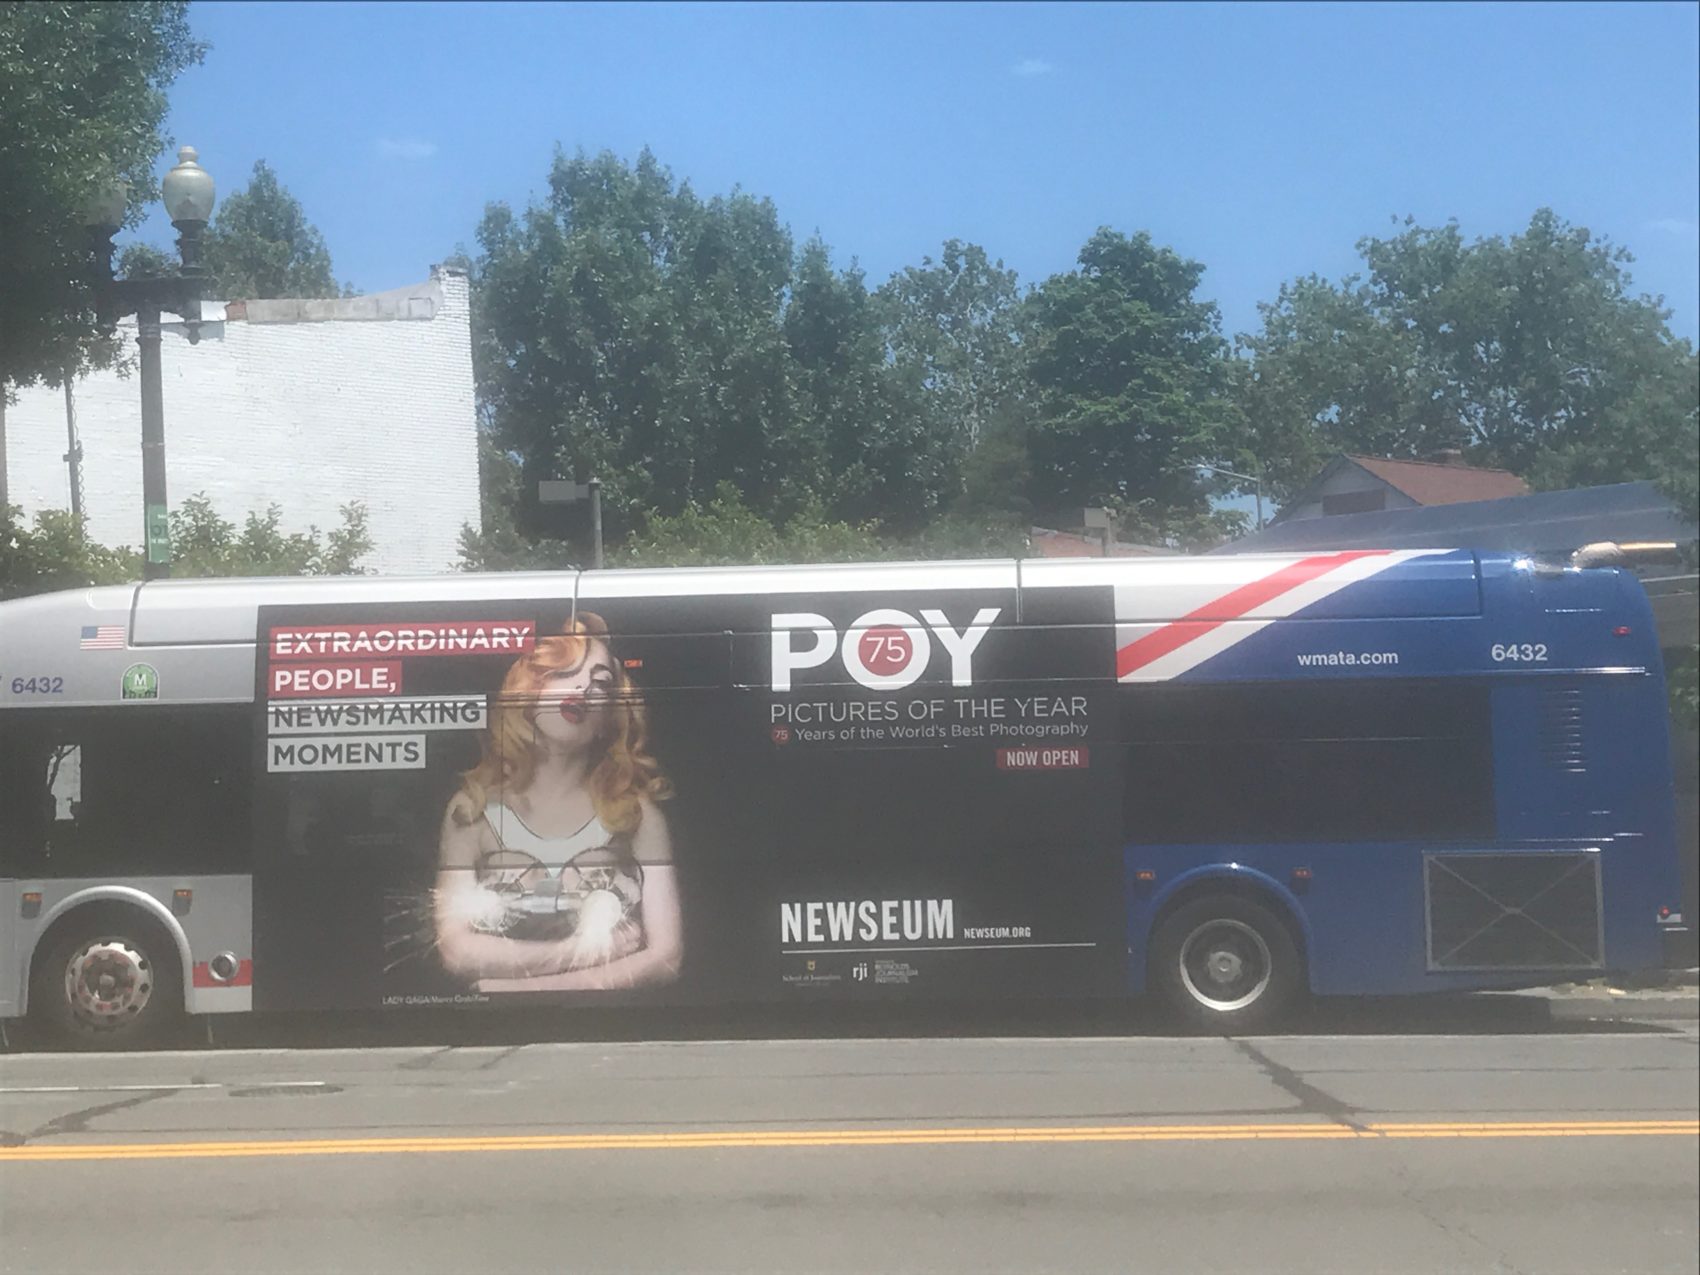
Bus ad wraparounds look cool to designers…
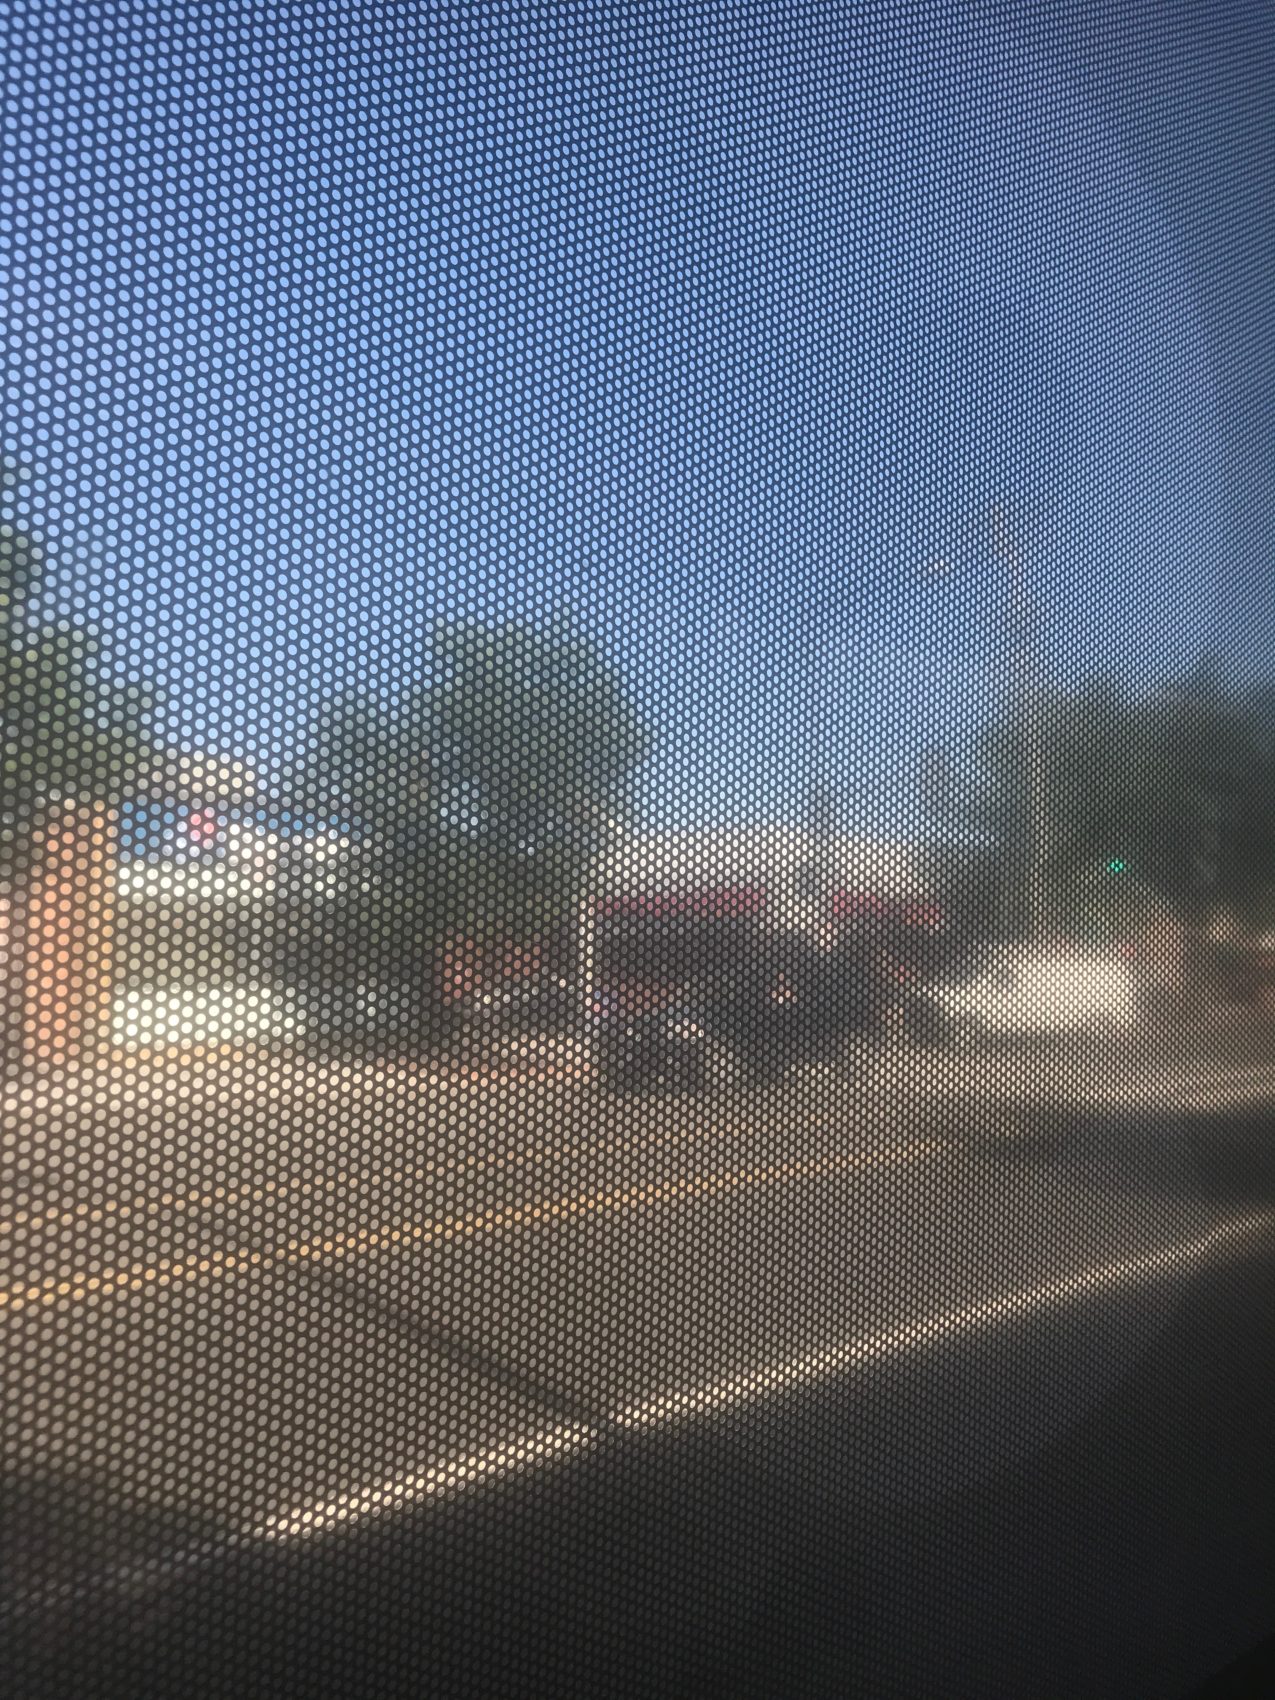
…but bus ad wraparounds also cover bus windows, obscuring outside views for passengers.
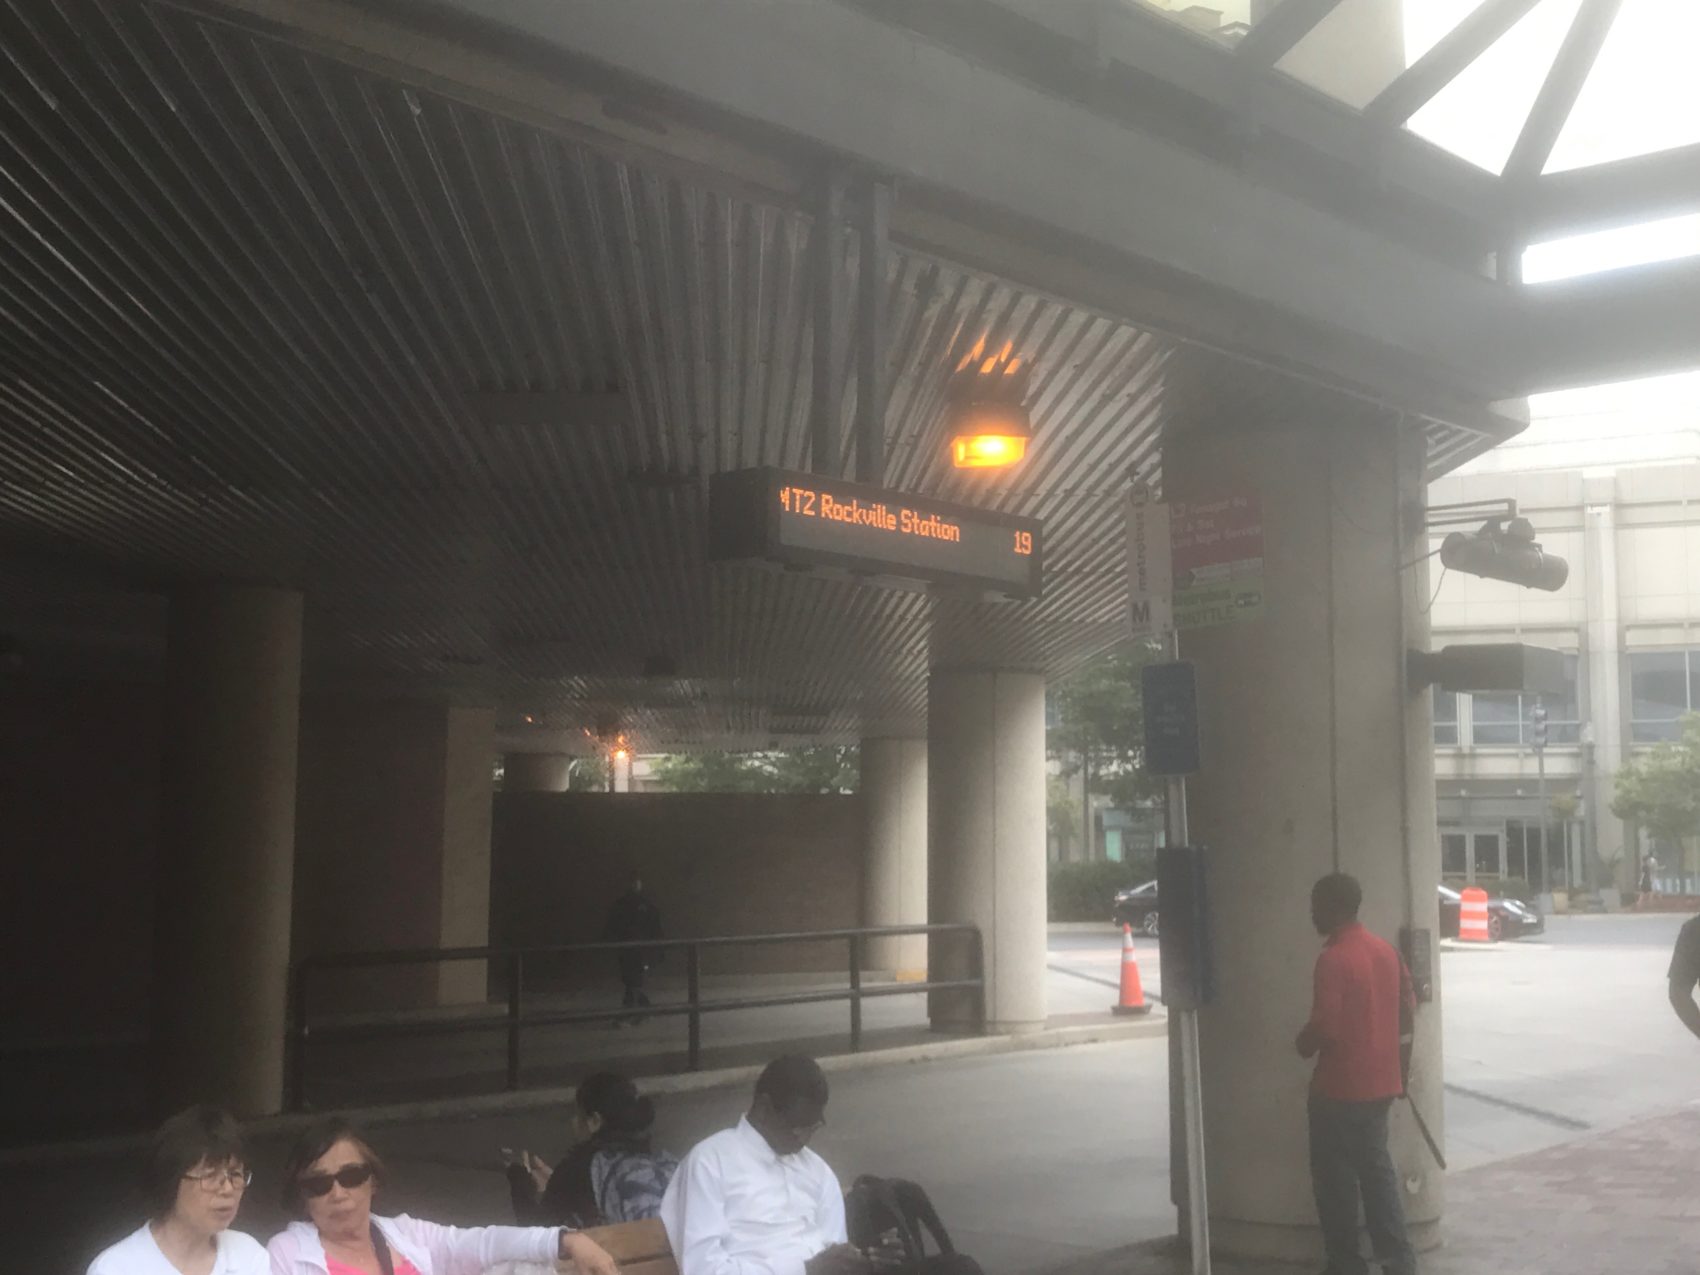
Newly-installed digital bus arrival schedules. For many years, users often had to guess when the next bus would arrive, as buses were often not on schedule. Or scheduled arrival times were too general.
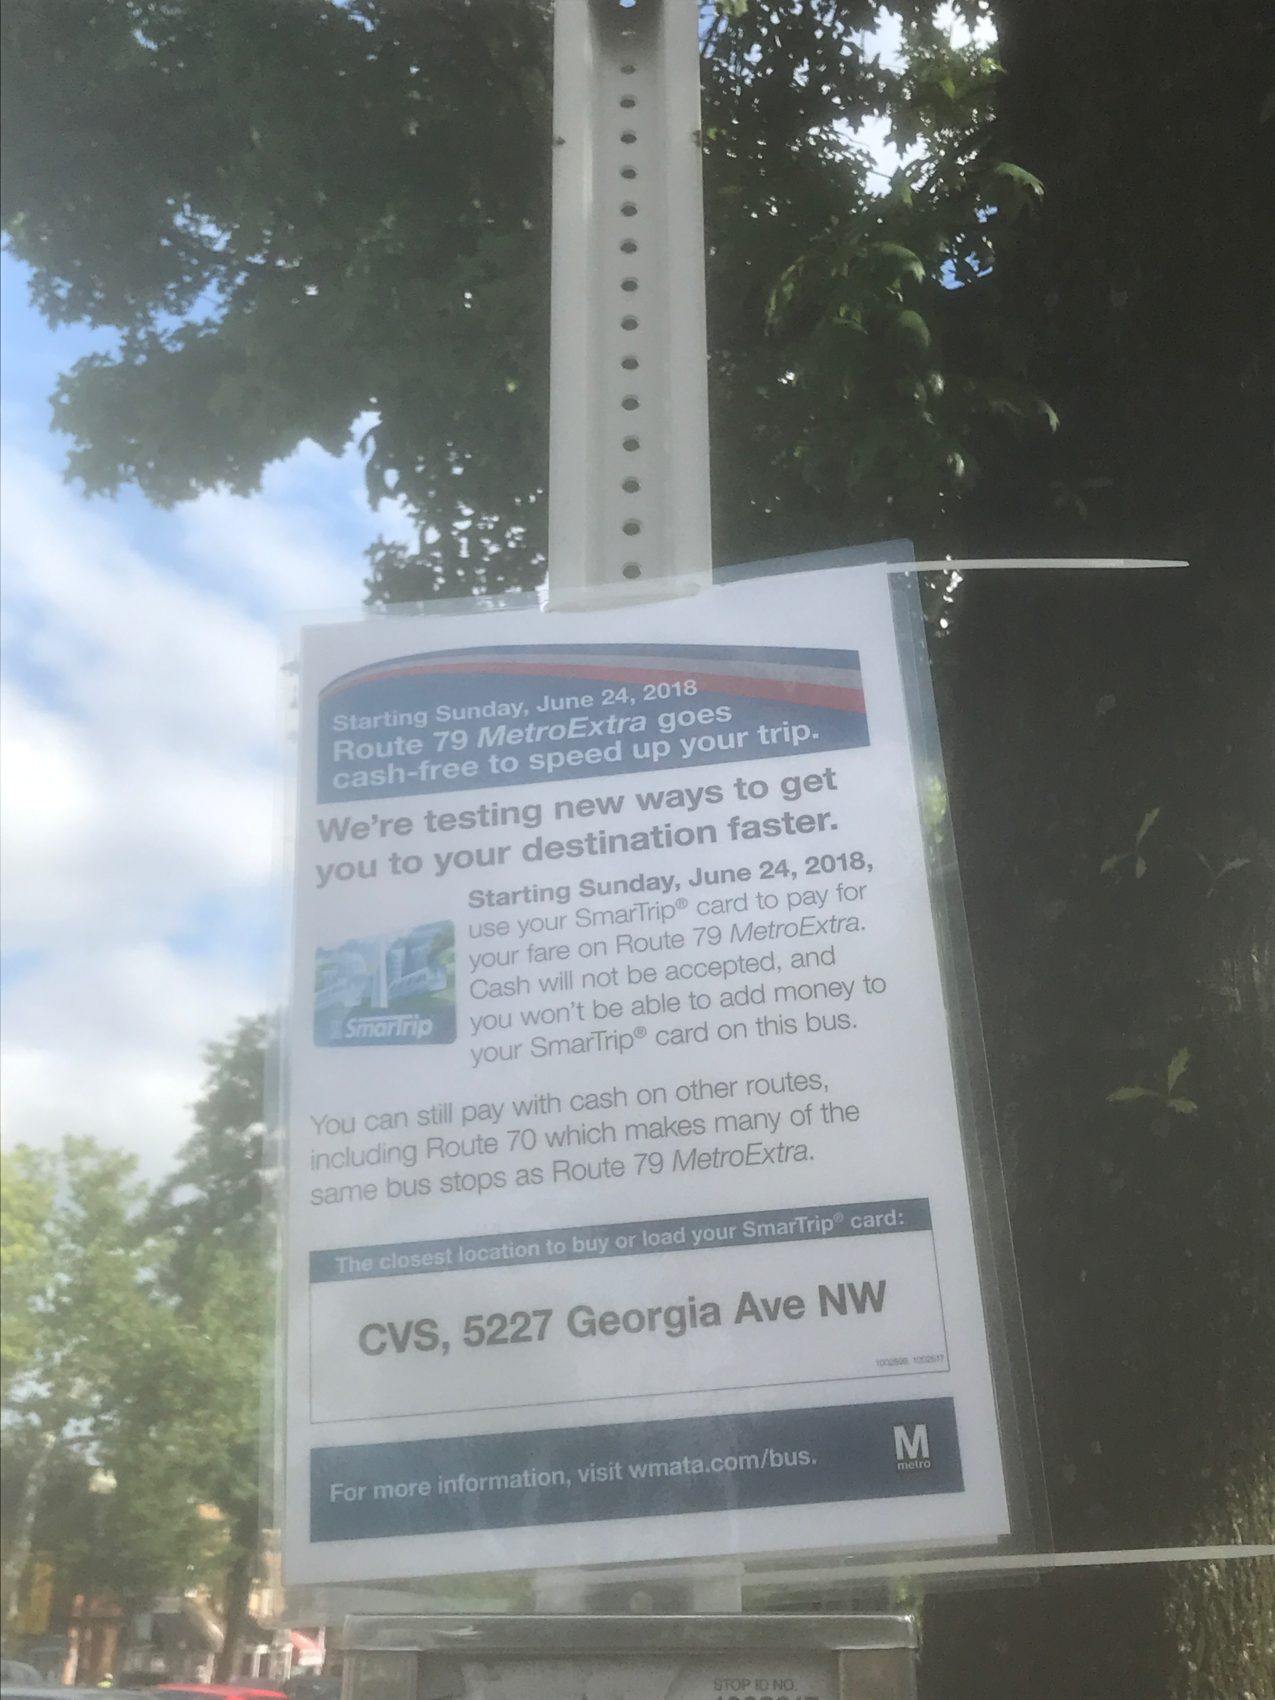
A bus line in my neighborhood was testing a new route. A positive observation was that they were communicating this to passengers.
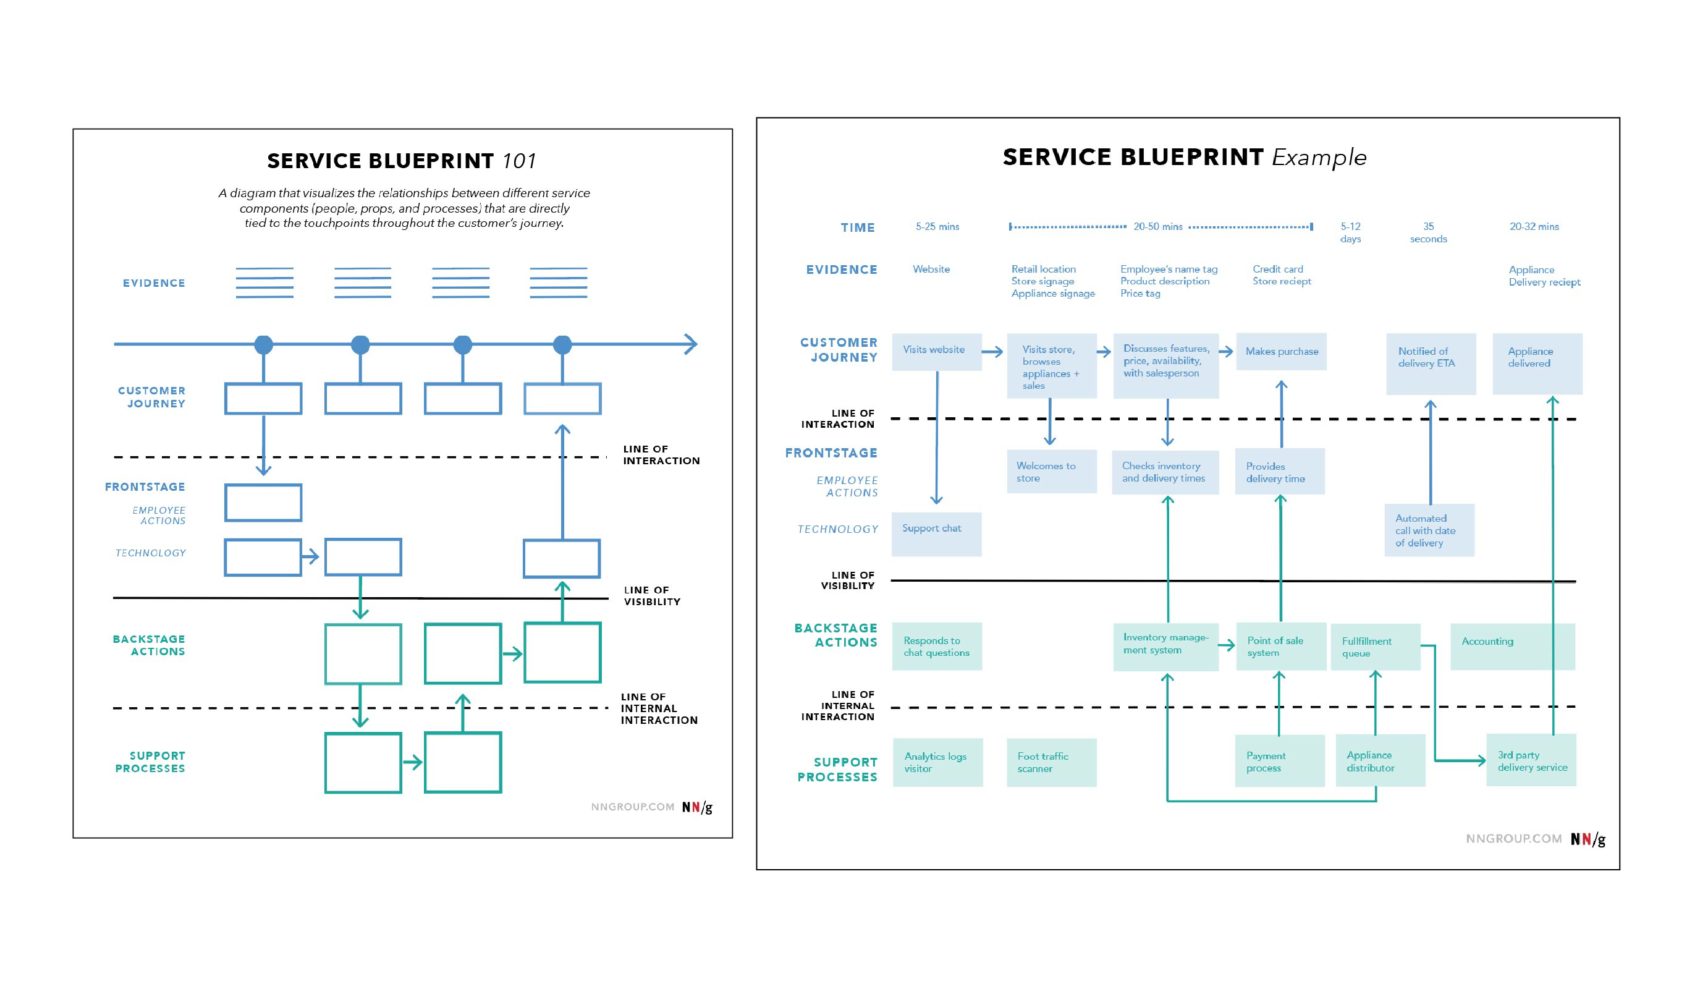
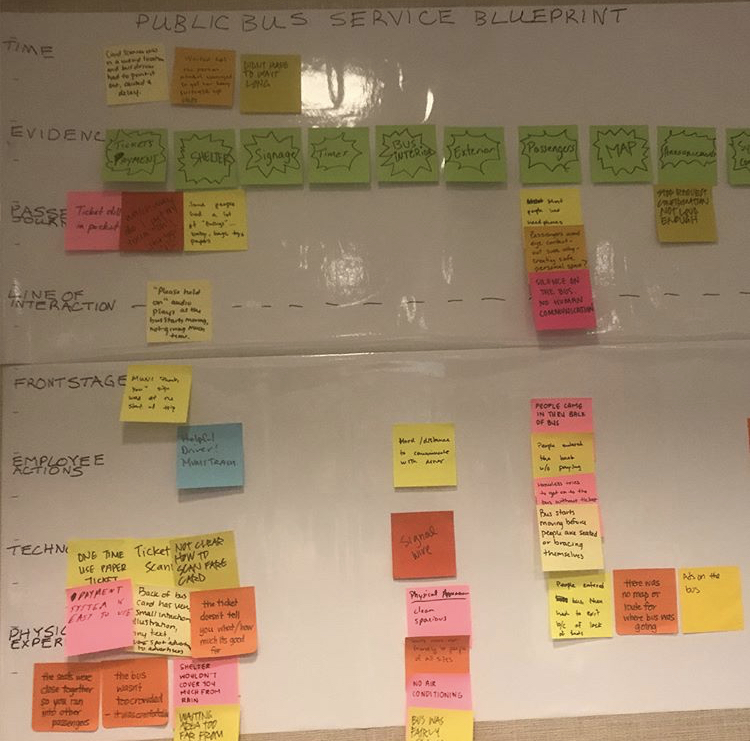
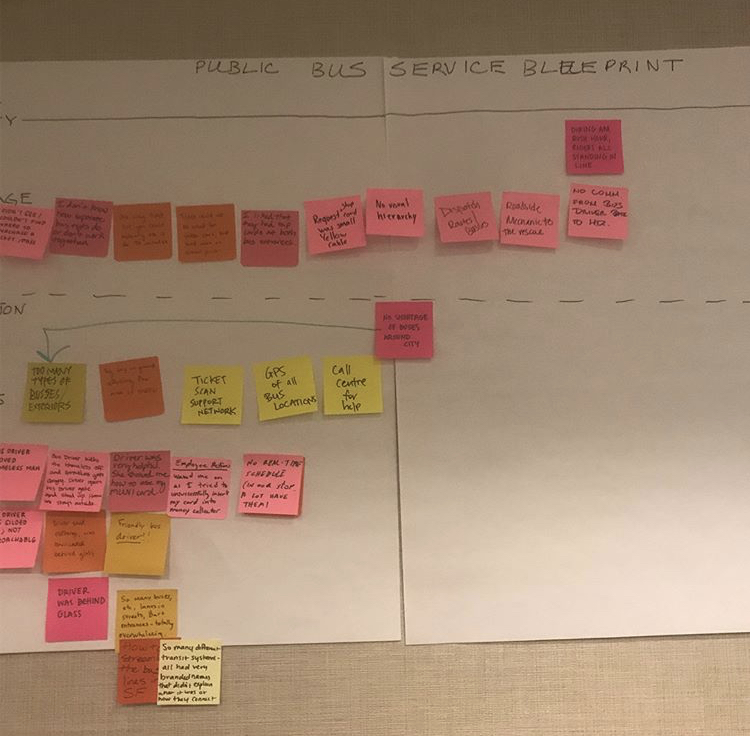
We then took the service blueprint template provided by the Nielsen Norman Group and tweaked it slightly to include Physical Experience within the Line of Interaction.
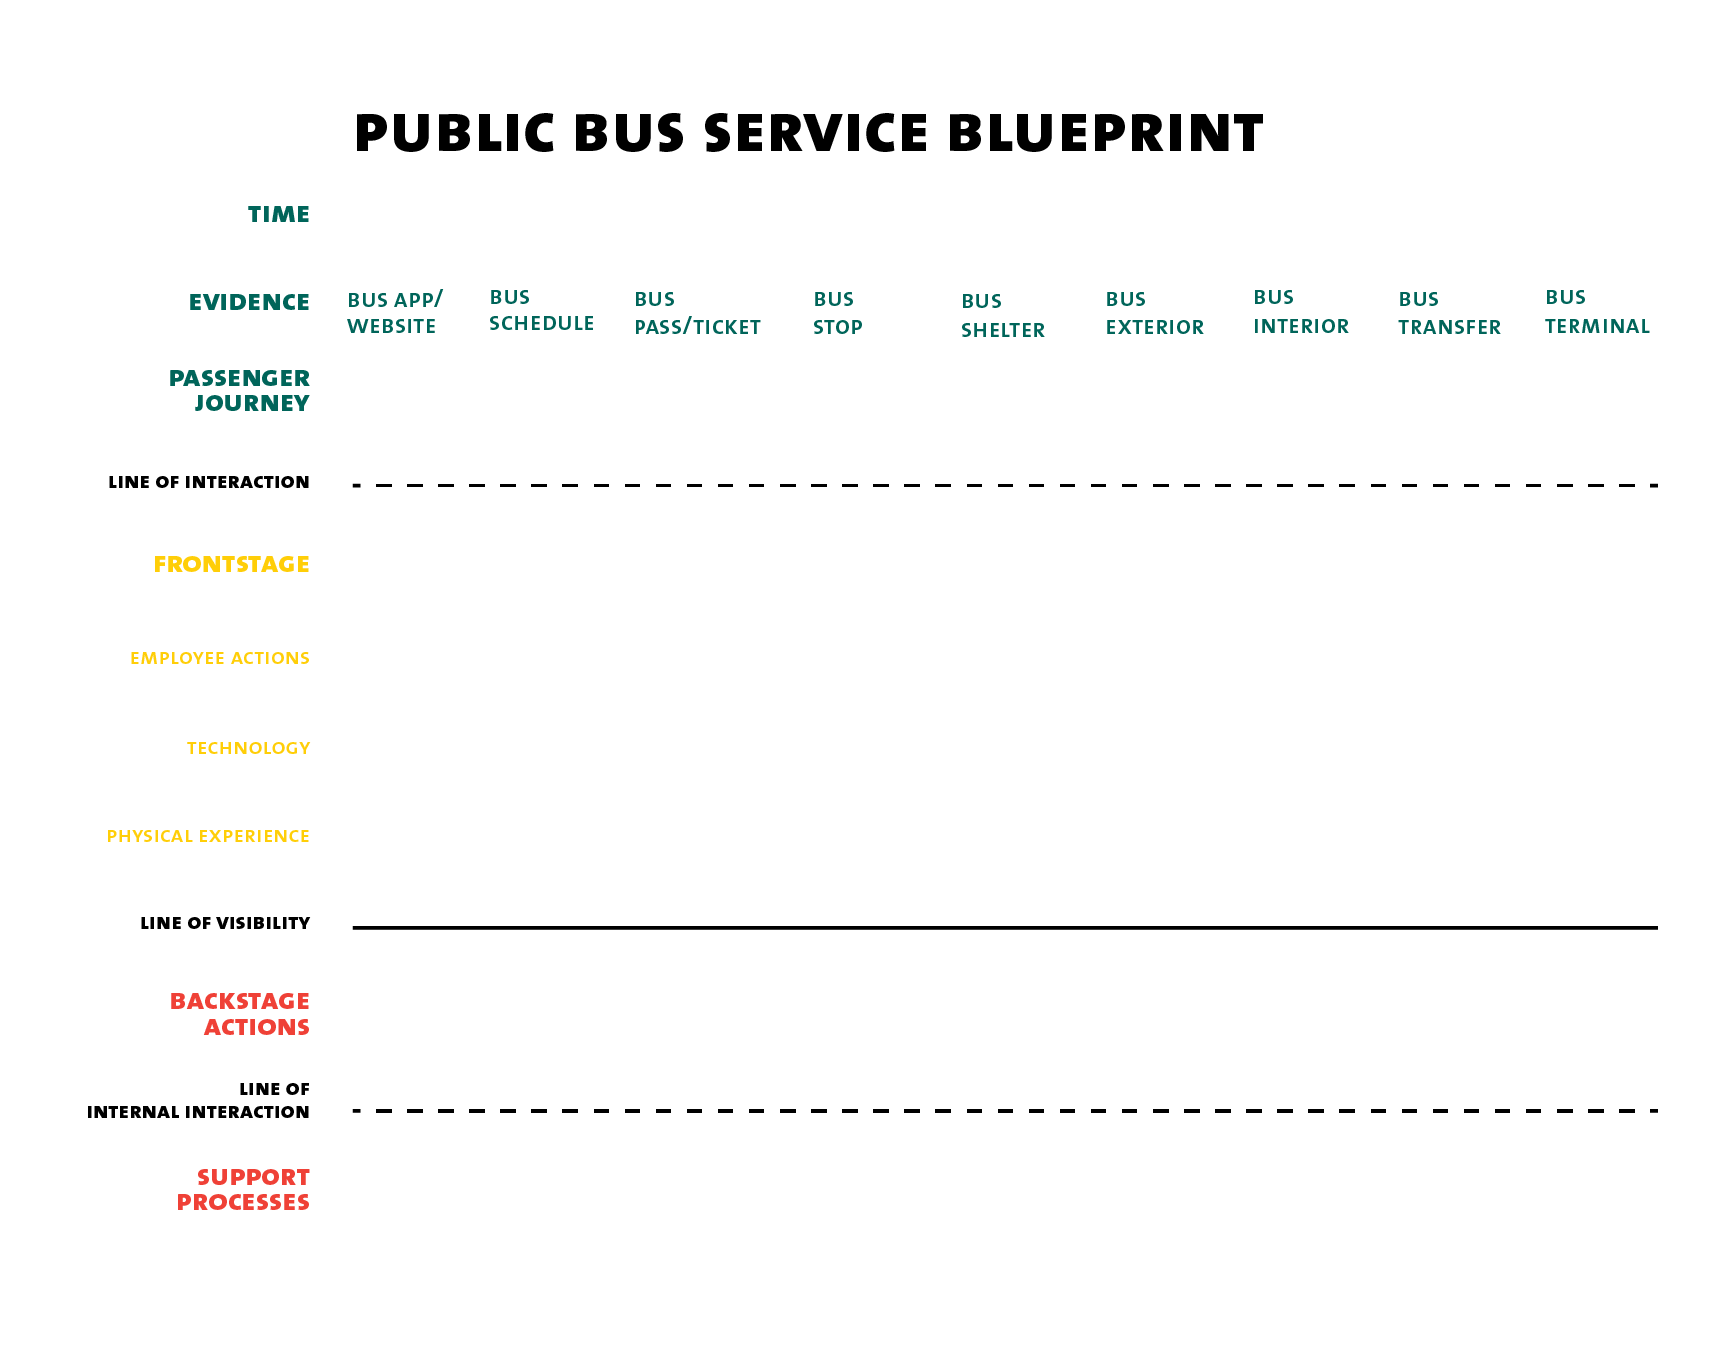
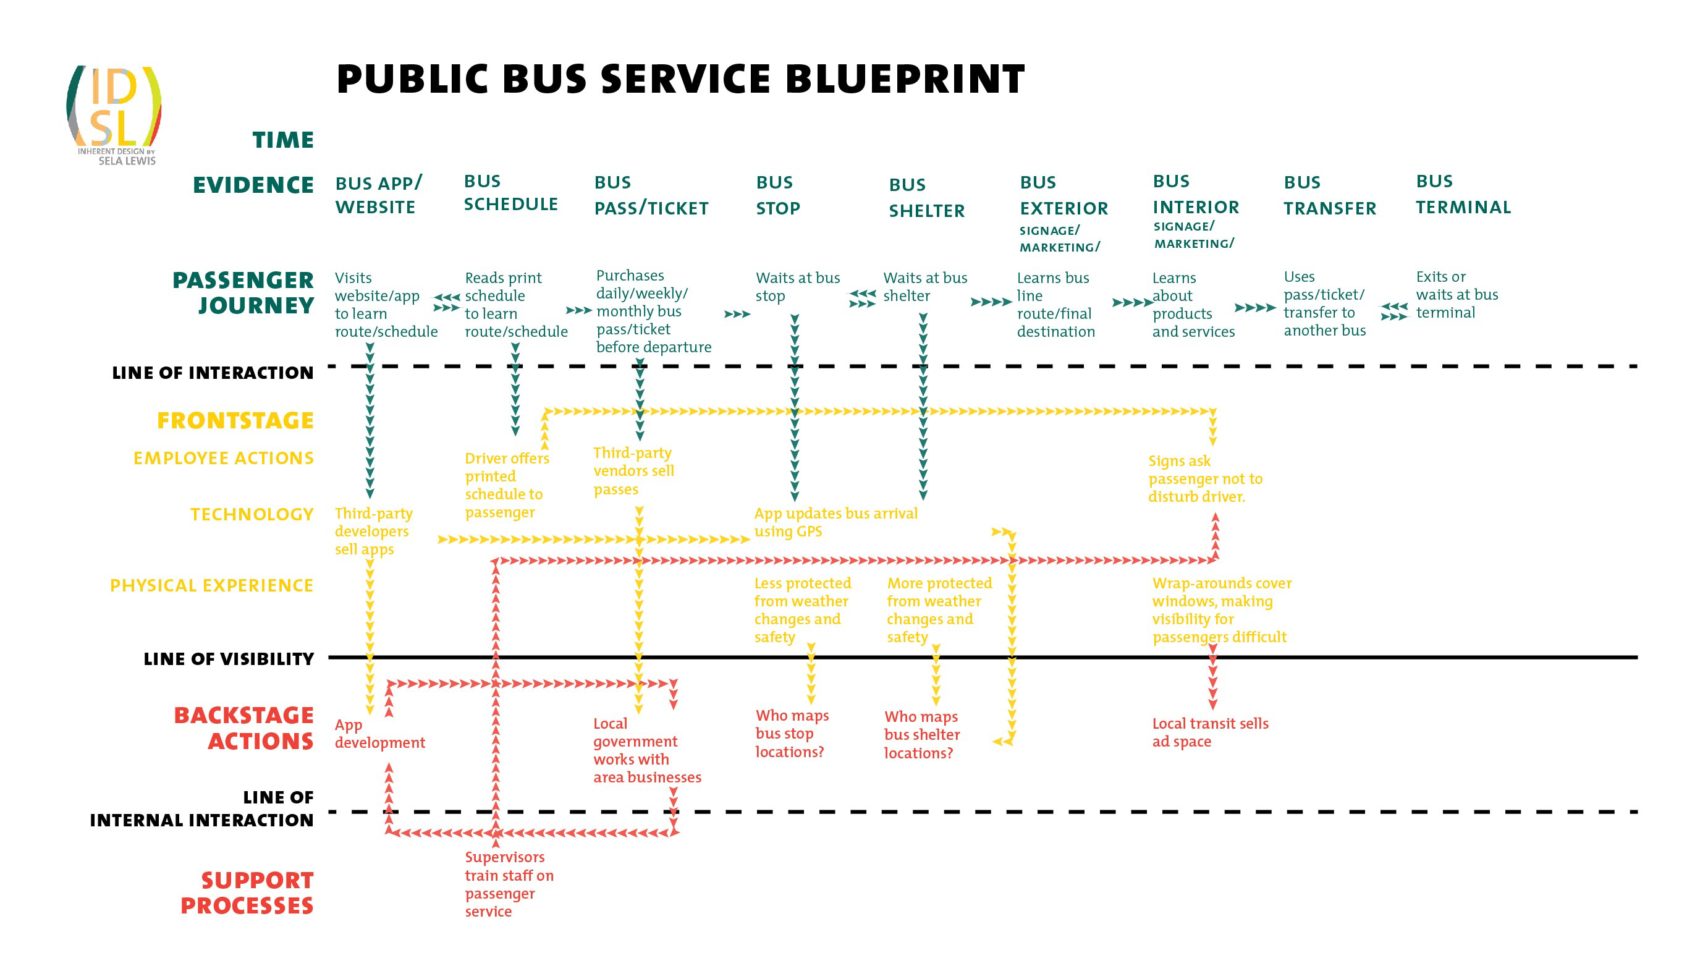
UNDERSTANDING THE FLOW LINES
In typical service blueprint examples, flow lines are relatively simple. But with a public bus system, we have to acknowledge the numerous front-of-the-house touchpoints. This slide also illustrates the limits to theorizing service mapping in isolation and in the abstract. This is my attempt to create a journey map on my own. Note the gaps and missing areas.
Mary Ann and I reserved a conference room in the D.C. public library to do our rapid prototyping, where we documented all of our observations. While we were able to observe some positive experiences (the bus was freshly cleaned), there were still many issues.
We conducted our field study on a Sunday, and the bus runs on a reduced schedule on Sundays. That particular day, the bus rerouted due to an event downtown. Our driver appeared to have been in a bad mood. She was reluctant to let down the stairs, as neither one of us appeared to be physically disabled. We were unclear about the cause of this friction. That day we chose an express bus, which at some point, completely changes the route to the regular service. When this express service was launched several years ago, WMATA made signs throughout express buses illustrating a full, but simplified route. As these routes became more popular, those maps disappeared. Now it is common to see new riders get scared and confused when the route suddenly changes. Guess who they will inevitably complain to? The bus driver.
One big takeaway from our experience was the importance of including bus employees — specifically bus drivers — to the service mapping process. They are often the ones who are on the direct frontlines to the service experience. They often field questions on which apps to use, which paper schedules to use when the next bus is arriving, how much are bus fares, is the next stop near the rider’s final destination, etc. Yet, bus drivers are also the ones implementing our recommendations. Having their insights considered would have been helpful. We didn’t know why the driver was so upset. Was she asked to cover a shift at short notice? Did she have a negative exchange with a passenger? Was she previously unaware of the reroute?
Ultimately, we concluded that surveys sent to drivers and bus supervisors are not nearly as helpful as engaging them in the process. So we followed up with the coordinator of UX Week to see about inviting employees of the MUNI to the conference as well.
MANAGING THE ZOOM
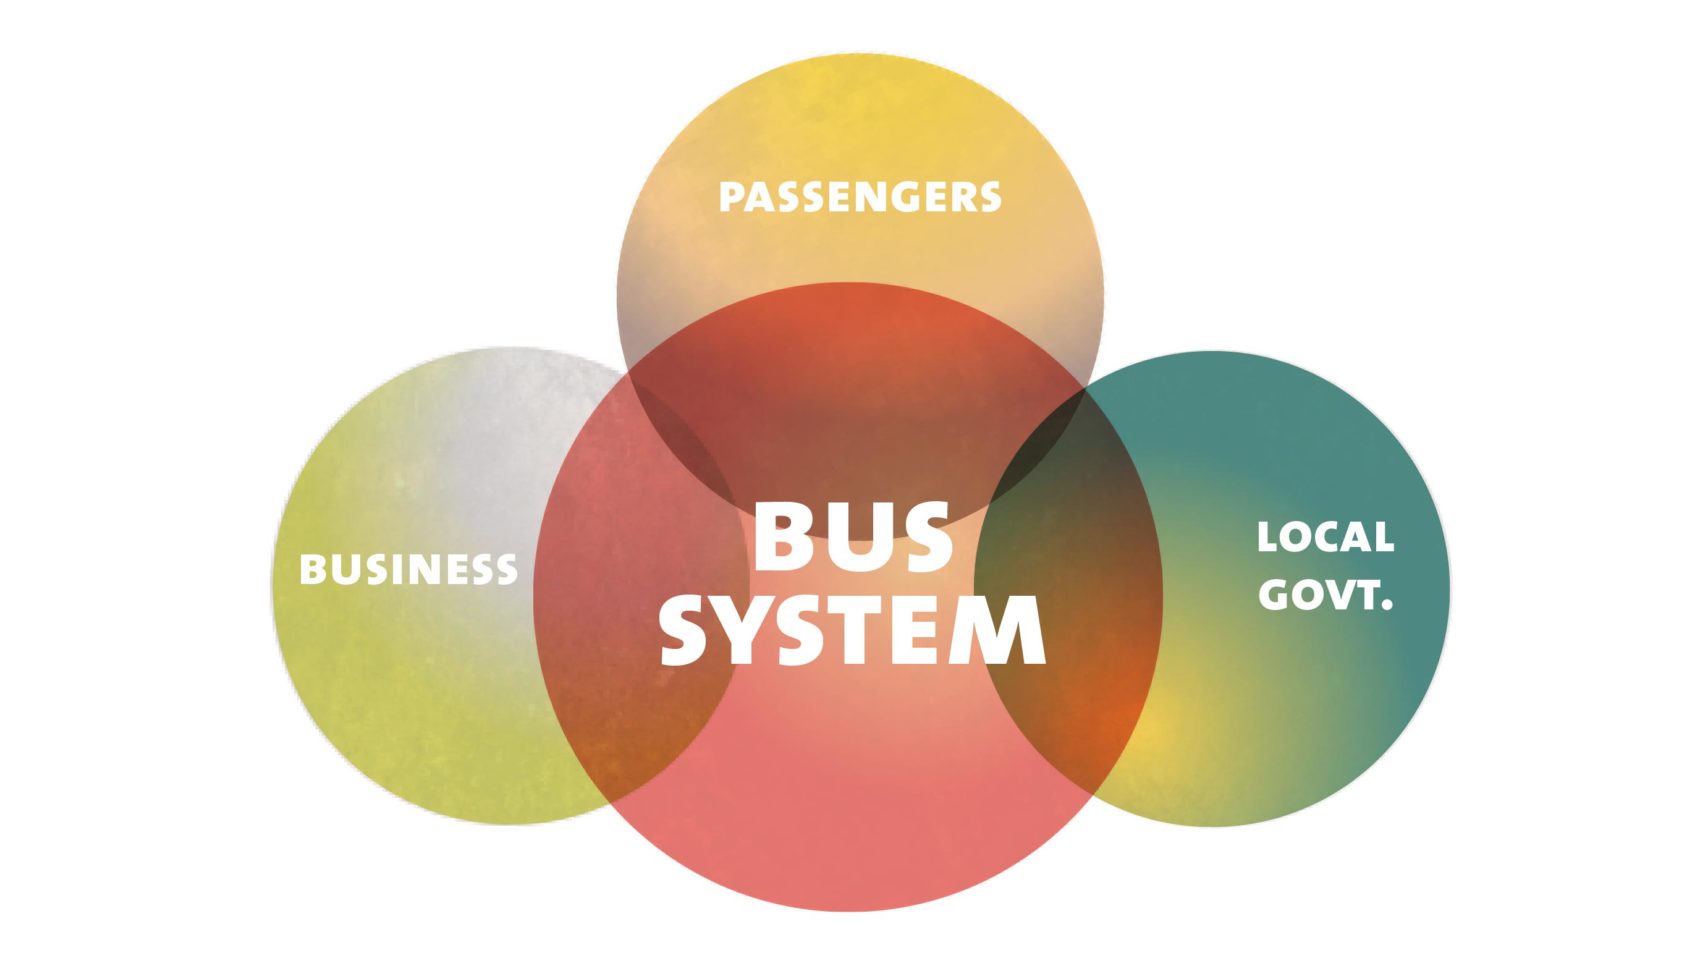
The typical service blueprint example is a restaurant. But when we’re talking about a public bus system, we knew that we were dealing with a much more complex service. It involves multiple municipalities, partnerships between businesses and other government agencies (such as law enforcement). Knowing that we may overwhelm attendees with too much scope, managing the zoom meant understanding the complexity of the system at a broader scale, while keeping in mind that our simple observations are enough to get started.
SAN FRANCISCO RESEARCH
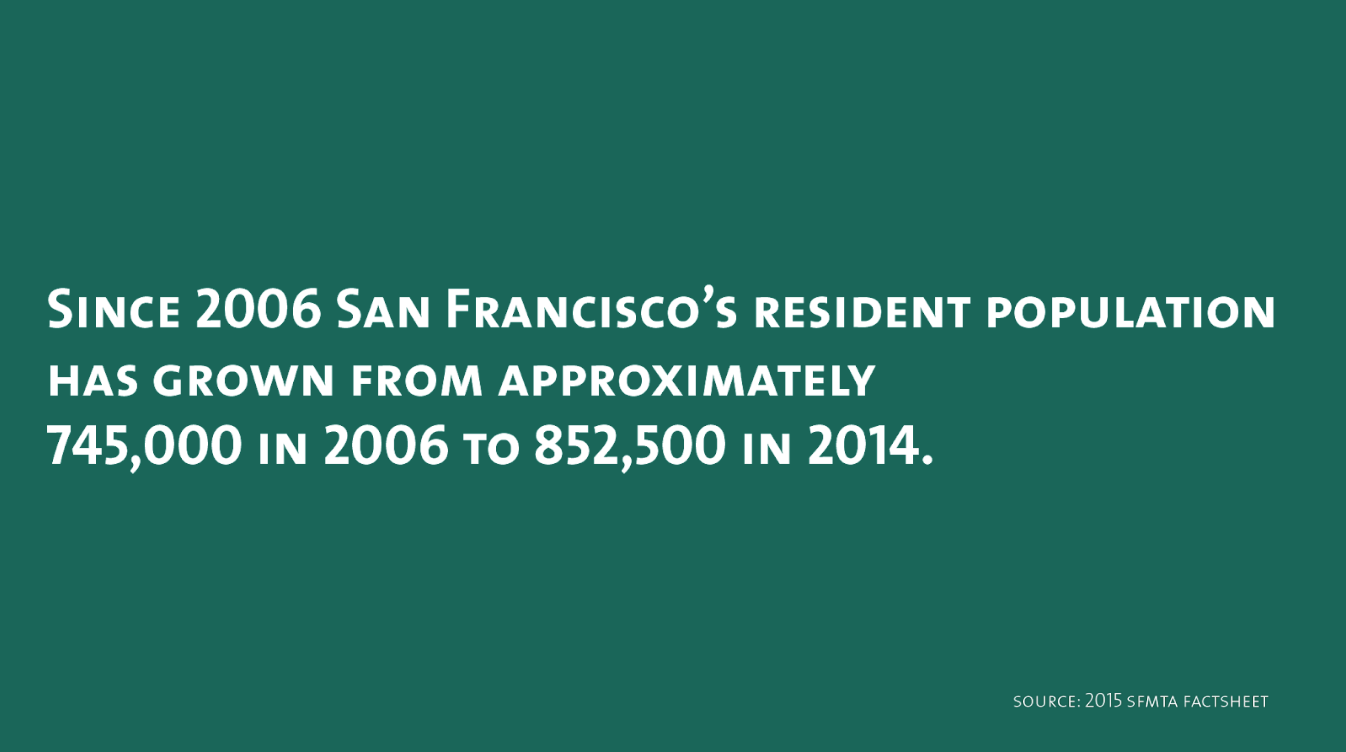
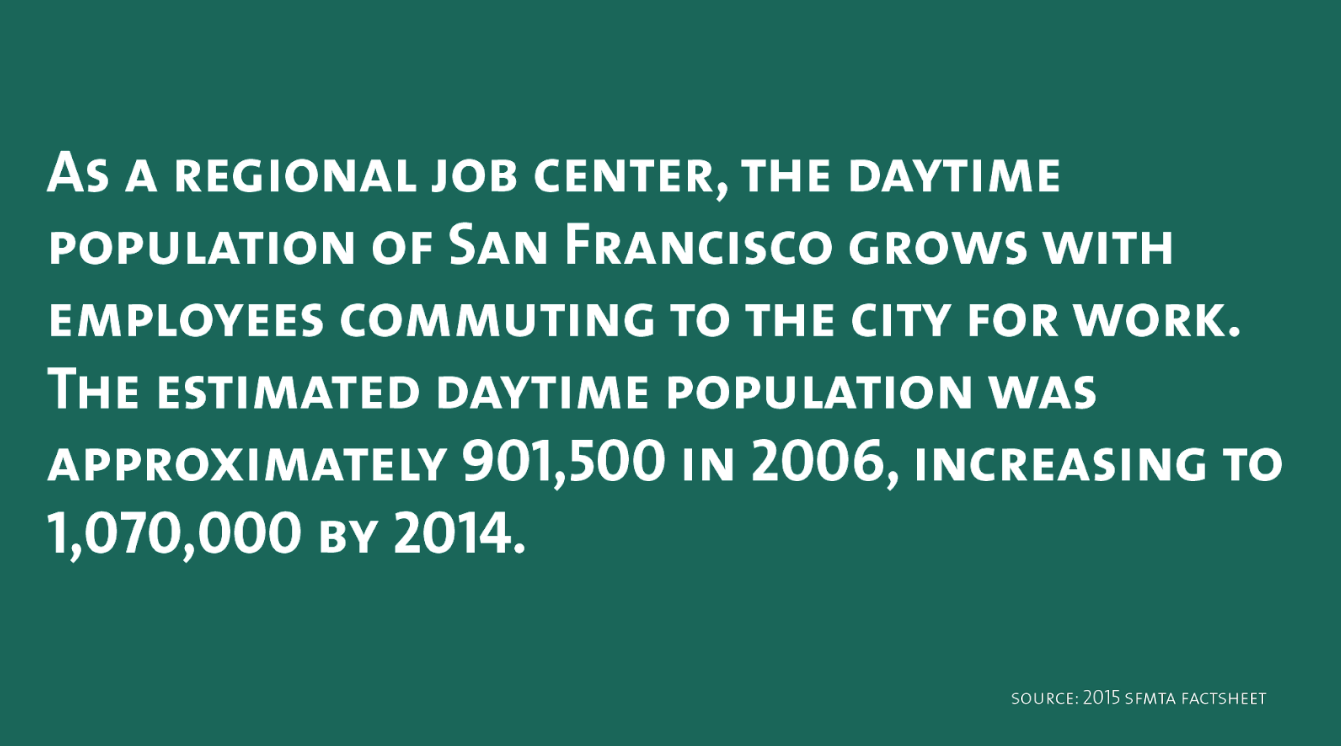
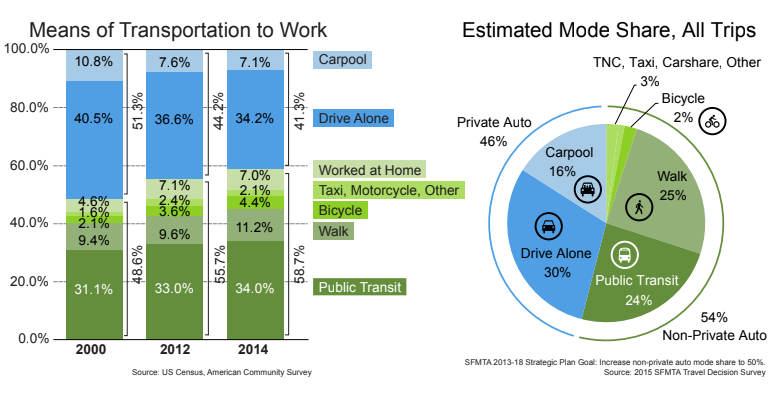
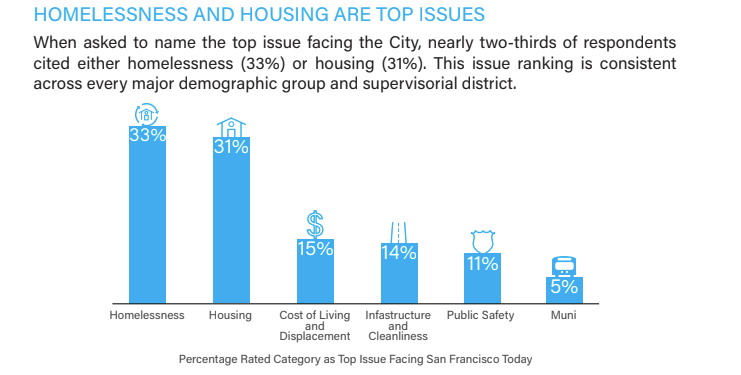
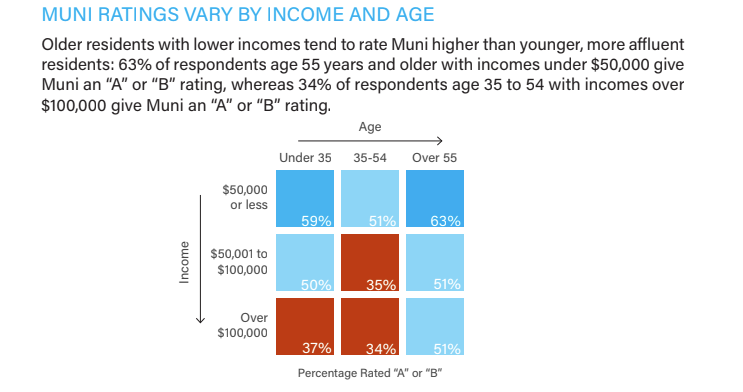
Given that our initial research was done in the Washington, DC Metro, I knew that our perceptions would be skewed. I also knew that we would meet with an international group of people, all with potentially varying degrees of experience with service design, public transportation, and the city of San Francisco. To provide some context for attendees on the scale of which we are zooming out, I researched publicly-available research on the population density and public transportation use in the region.
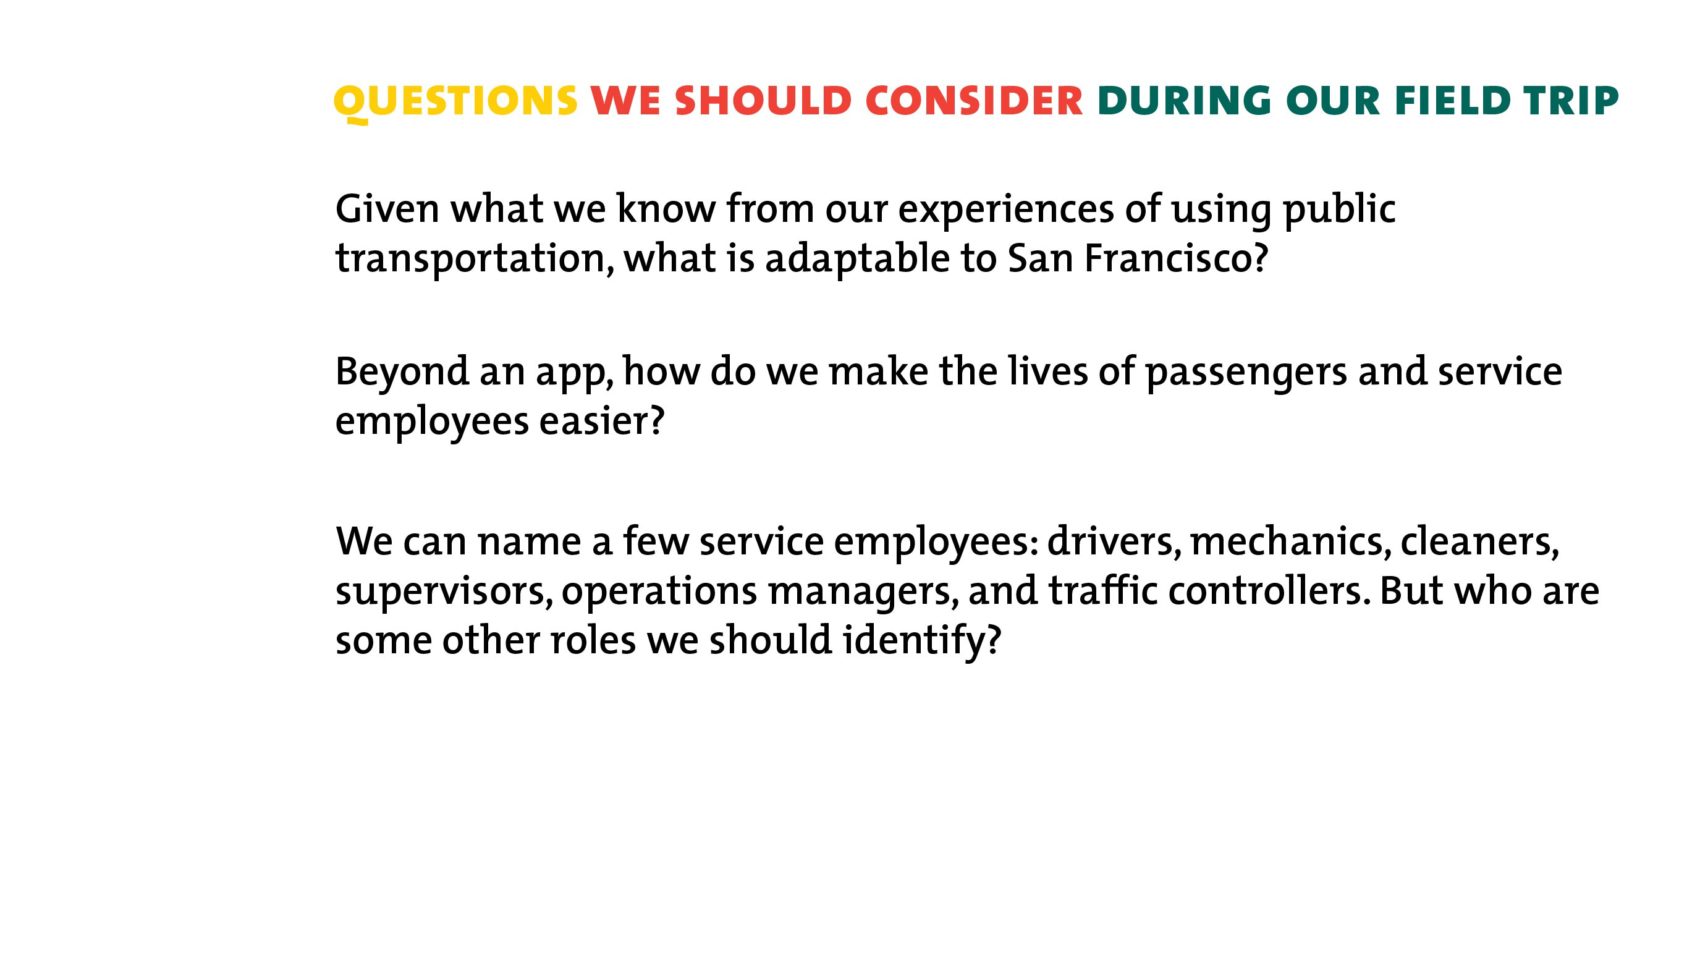
Before our field trip, we gave workshop attendees questions to consider during the trip.
FIELD TRIP TIME
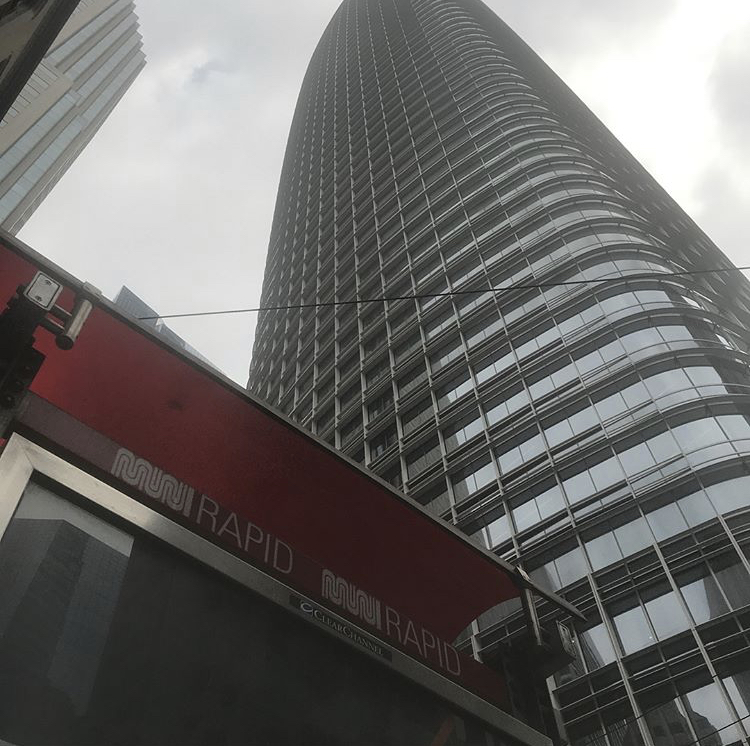
Several MUNI bus and trolley lines run within blocks of the conference.

We conducted our workshop by breaking up attendees into three groups. Then myself, Mary Ann, and a workshop assistant each lead a group in separate buses.
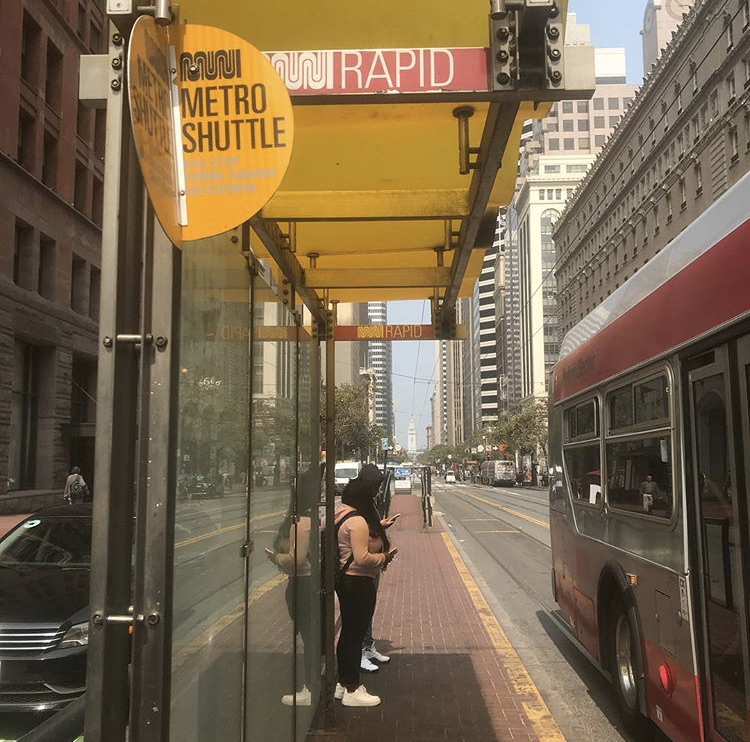
A MUNI bus stop located extremely close to buses and cars.
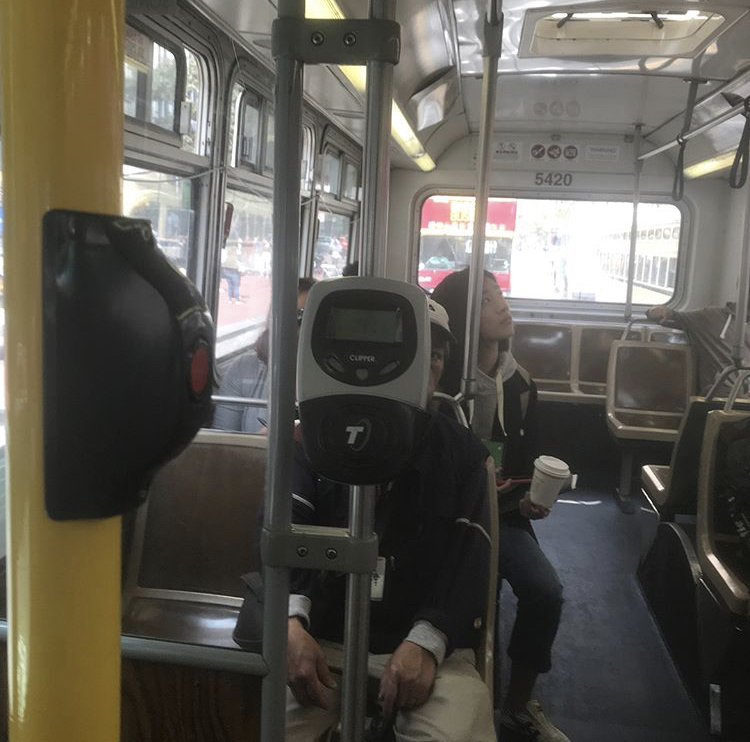
A UX Week attendee (holding cup of coffee) observes the MUNI and records her findings.
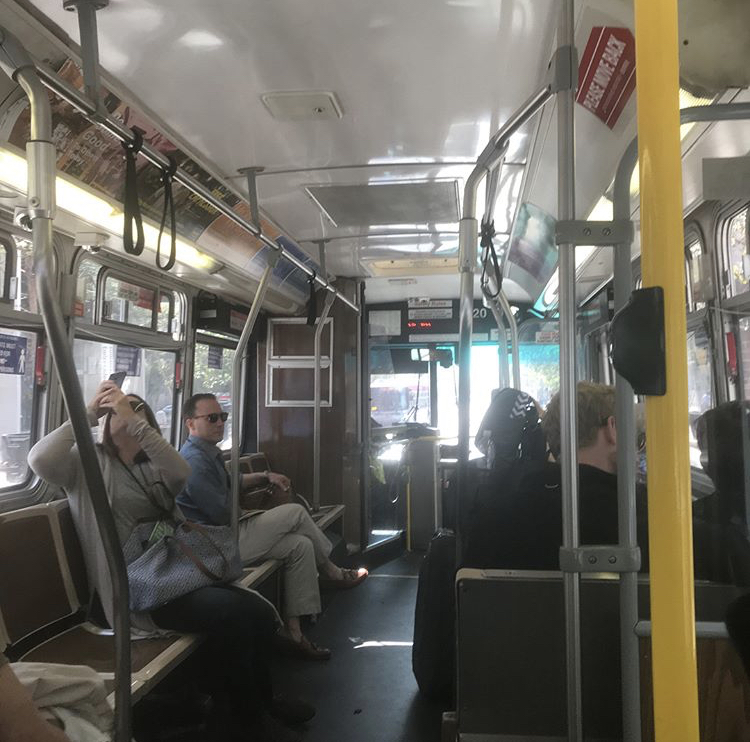
UX Week attendees (far left) record the bus interior.
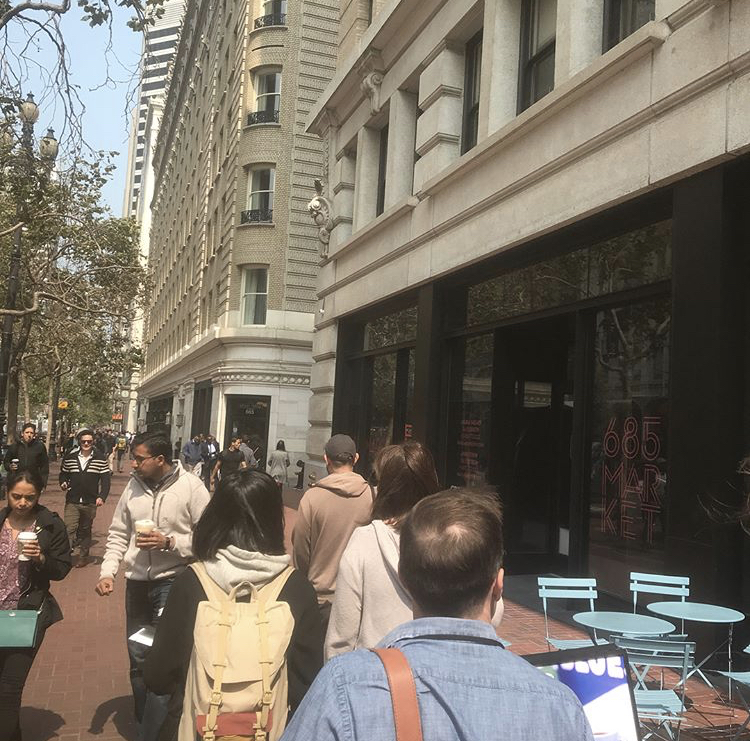
Our walk back to the hotel. We used this time to unpack our observations, compare bus systems from other cities where we live. For example, I met one person from Boston and another person from Richmond, VA.
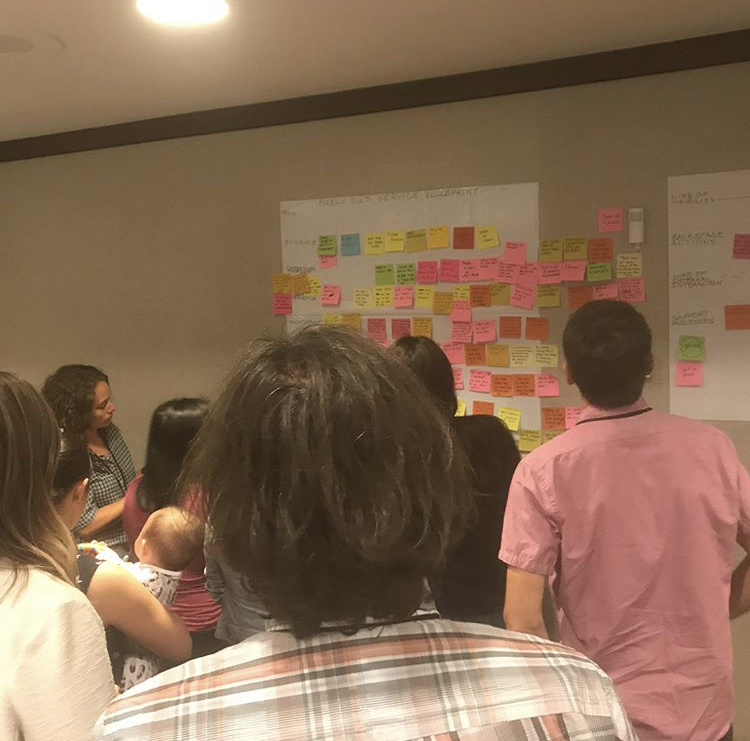
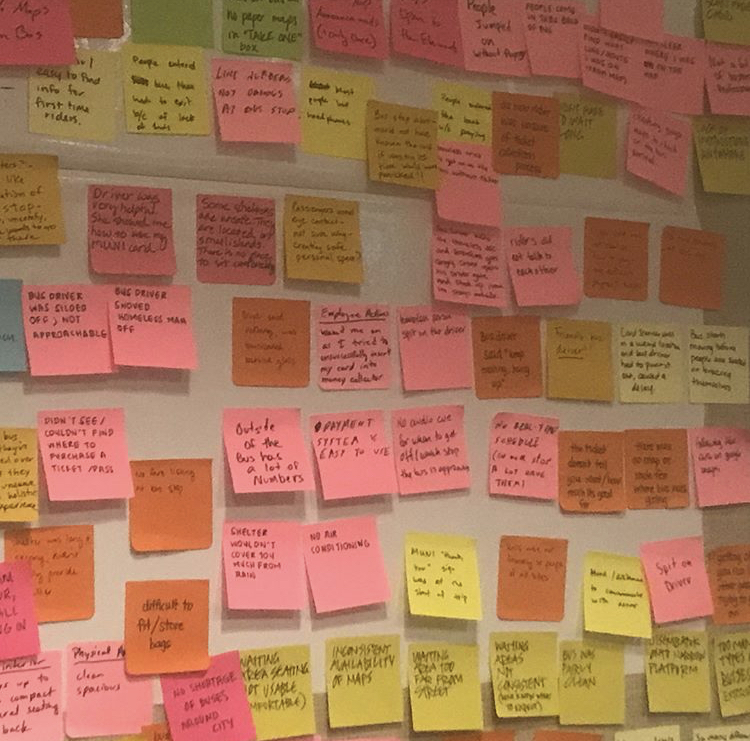
Back in the conference room for rapid prototyping.
The biggest problems we discovered were an excess of bus lines MUNI apps. Streamlining service within the existing infrastructure was a key takeaway.
BIG TAKEAWAYS
Highlighting Service Patterns within the MUNI
As I said earlier many designers turn to apps to solve problems of public transportation. To test whether or not there is an advantage to using an app to better navigate San Francisco, Mary Ann download a couple of MUNI-related apps, and I did not. Her initial observations were that there are too many MUNI apps to choose from. It is hard to know which one is the official app of the system. When we returned from the field trip, Mary Ann and attendees from her group shared that they were no better at navigating the city of San Francisco using MUNI-related app than our group who didn’t use any apps at all.
I am all for digital solutions. But not every solution is an app. A solution can be streamlined digital screens at every safely-located bus shelters. A solution can be a consolidated marketing campaign to promote one single digital app that is free for people to use.
Direct issues with the service were multiple trolley and bus lines running in the same direction produced a lot of congestion and confusion. Pair that with shelter islands that were in unsafe areas for riders. And bumps on the seats to prevent people from sleeping there, sent the message that the city was not very invested in promoting a safe, comfortable experience on the MUNI.
Blog Post | Using Service Design To Serve The Public
Getting Out of Our Comfort Zones
After our observations, we learned that some of the biggest challenges with the service involve homelessness, public drug use, public mental illness. For one particular group, they observed that a barely-clothed woman was kicked off the bus for spitting at the driver. So it reveals the challenges that go beyond providing bus service but are still important to address if we want to improve the service for everyone.
Date
September 9, 2018
Categories
- Presentations
- Service Design
- User Experience
- User Research